|
TraceDisplay allows you not only to view the various system logs but also to view system logging in realtime.
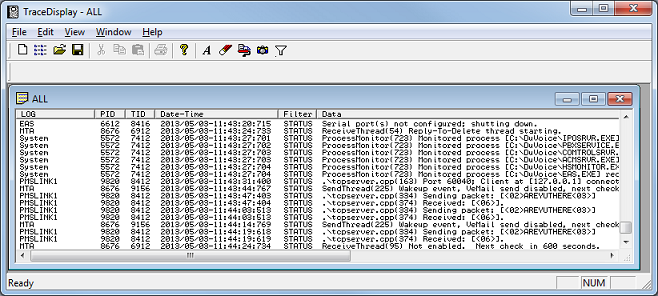
The figure below shows the main TraceDisplay window with a single child window displaying realtime log statements for all logs.

The data displayed is largely intended to aid technical support in troubleshooting system problems and will not be discussed in any detail here. However, an onsite technician may also find these logs useful for troubleshooting on occasion. The following table provides a basic overview of the fields contained in each log entry:
Column
|
Description
|
Log
|
The base name that identifies which log the entry was logged to.
|
PID
|
The process ID of the process from which the log entry was generated.
|
TID
|
The thread ID of the thread from which the log entry was generated.
|
Date-Time
|
The date and time when the log entry was logged.
Format is Year/Month/Day-Hour/Min/Sec.msec.
All values are padded with leading zeros; the millisecond value is padded to three digits and all others to two digits. The hour value is always in 24-hour clock notation.
|
Filter
|
Filter level. Can be ignored.
|
Data
|
The actual log statement generated by the service.
Log statements can be a little cryptic and are generally intended as a debugging aid for the manufacturer's technicians and developers. Still, they can sometimes be useful even to on-site technicians to verify or troubleshoot certain issues.
|
Viewing Logs in Realtime
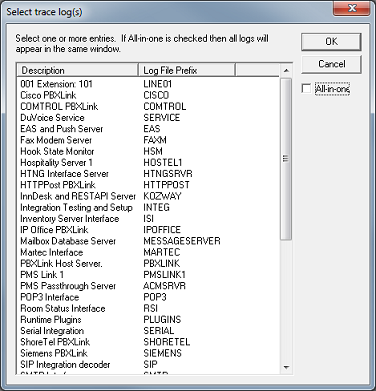
To view one or more logs in realtime, select File | New, press Ctrl-N, or click the toolbar icon that looks like a blank page. This will open the log selection dialog, shown below.

Select the logs you want to view. To select multiple logs, hold the Ctrl key while clicking on each log you want to view, then click OK. A new window will be opened for each log selected, each displaying log statements for the given log, as they occur. To view all log statements in a single window, check the All-in-one box before clicking OK.
If you want to view all logs in realtime, you can do so by selecting File | Open All, pressing Ctrl-A, or clicking the Open All toolbar icon (second from the left).
Taking a Snapshot
Sometimes, particularly if you viewing the logs in debug mode, the logging statements may accrue faster than you can read them. If you are viewing the log(s) to catch a particular event, you can wait for the event to occur and then take a "snapshot" of the log by clicking on the camera icon on the toolbar (the next-to-last icon).
This will open a new window that will contain all the log statements from the active window up until the point you clicked the icon. You can then peruse those statements at your leisure while the main window continues to accrue log statements in realtime.
Resetting the View
If you are viewing one or more logs live in order to debug a particular event, you may end up combing through dozens (if not hundreds) of log statements looking for the ones that specifically relate to the event you are debugging. To help alleviate this problem, an erase option is available on the toolbar (the eraser icon). While the log is running, you can click that icon to instantly delete all data from the window. This does not delete the statements from the log file, only from the window.
So, for a typical debugging session, you could open a window set to display the appropriate log(s) in realtime, wait until just before the event occurs that you are trying to debug, click the erase icon, wait for the event to occur (and finish), and then click the camera icon to open a window that displays all the log statements from the active window up to the point you clicked the icon (as discussed in the Taking a Snapshot section above).
To clear all windows displaying realtime data, click the Clear All icon on the toolbar (the one to the right of the eraser icon).
Viewing Existing Log Files
To open a log file to view past logging statements, select File | Open, press Ctrl-O, or click on the File Open icon on the toolbar. This will open a standard Windows File Open dialog from which you can select the file you want to view. Select the file and click Open to open it in a new window.
Changing the Font Size
TraceDisplay offers two font sizes it can use when displaying log data, Large and Small. By default, it uses the Small font. To toggle between the two font sizes, click the font button on the toolbar (the one with the picture of the letter A). This will toggle the font size in all open windows.
Setting the Log Filters
Normally, only a very minimal amount of log statements are generated, including error statements. However, when a technical support agent is trying to debug a particular problem, he or she may need to increase the amount of logging in order to better track what is occurring within the system. This can be done by changing the filter settings in TraceDisplay.
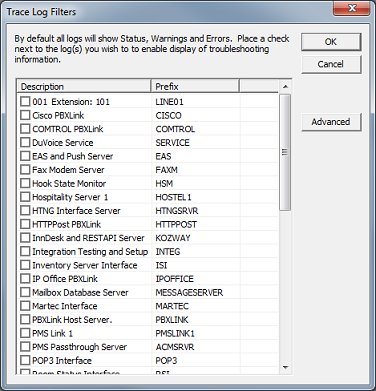
To change the filter settings, select View | Filters; this will open the dialog shown below.

To have the system log in debug mode for a particular log file, click the checkbox in the Description column. If the box is not checked, then only the standard status, warning and error statements will be logged.
The Advanced button opens a sub-dialog that allows more fine-tuned control over the logs; this is intended as an aid to the system developers and is not covered here.
The table below lists the various log files you can view and what each one contains:
Log File Prefix
|
Description
|
LINExx
|
View these logs when troubleshooting issues with telephony user interface or other call-related activity.
There is a separate log file for each line, where xx is the line number.
|
CISCO
|
View this log when troubleshooting name and user rights changes on a Cisco PBX.
|
COMTROL
|
View this log when troubleshooting communication issues with any PBX using the Comtrol interface.
|
SERVICE
|
View this log when troubleshooting the main DuVoice service.
Contains logging for the startup, shutdown and restarting of all servers monitored and managed by the DuVoice service.
|
EAS
|
View this log when troubleshooting the EAS and push server.
|
FAXM
|
View this log when troubleshooting the fax modem server.
This is for legacy fax cards only. If you are using Dialogic voice cards with fax support built in, all fax activity is logged in the respective LINE logs.
Note: Fax support is not available on SIP-enabled systems.
|
HSM
|
View this log when troubleshooting the hook state monitor.
|
HOSTELx
|
View this log when troubleshooting the hospitality server. There is a separate log for each instance, where x indicates the instance number (starting at 1).
For most systems, this will always be HOSTEL1. Additional server instances are only supported on systems licensed for multiple PMS instances.
|
HTNGSRVR
|
View this log when troubleshooting the HTNG PMS interface.
|
HTTPPOST
|
View this log when troubleshooting name and user rights changes on a PBX that uses the HTTP Post interface (e.g., an IPitomy PBX).
|
KOZWAY
|
View this log (and the HOSTEL log) when troubleshooting InnDesk issues.
|
INTEG
|
View this log when setting up and testing a PBX integration.
|
ISI
|
View this log when troubleshooting the Inventory Server Interface IVR.
|
IPOFFICE
|
View this log when troubleshooting name and user rights changes on an Avaya IP Office.
|
MESSAGESERVER
|
View this log when troubleshooting notifications or issues with the mailbox database.
|
MARTEC
|
View this log when troubleshooting the interface with the Martec interface.
|
PBXLINK
|
View this log when troubleshooting issues with the PBX link host service.
In most cases, you will want to view the PBX-specific log file either instead of or in addition to this log.
|
PMSLINKx
|
View this log when troubleshooting the communication link between a PMS and the hospitality server. There is a separate log for each instance, where x indicates the instance number (starting at 1).
For most systems, this will always be PMSLINK1. Additional server instances are only supported on systems licensed for multiple PMS instances. For systems that are not connected to a PMS, there may not be a PMSLINK log file.
|
ACMSRVR
|
View this log when troubleshooting the hospitality link between the voice mail service and an Avaya ACM, Mitel, or Nortel PBX (or an NEC PBX that uses either the NEC NEAX Model 60 or NEC KTS-i w/ENQ interface).
|
POP3
|
View this log when troubleshooting the POP3 interface for VeMail.
|
RSI
|
View this log when troubleshooting the Room Status Interface IVR.
|
PLUGINS
|
View this log when troubleshooting the telephony user interface.
|
SERIAL
|
View this log when troubleshooting a serial PBX integration.
Note: This is not the log to view for a serial PMS link or a serial hospitality interface link to a PBX. In the former case, view the PMSLINK log. In the latter case, view the ACMSRVR log.
|
SHORETEL
|
View this log when troubleshooting name and user rights changes on a ShoreTel PBX.
|
SIEMENS
|
View this log when troubleshooting name and user rights changes on a SIEMENS PBX.
|
SIP
|
View this log when troubleshooting the SIP integration decoder.
Note: For most SIP integration troubleshooting, you will actually want to view the INTEG log and/or the LINE logs.
|
SMTP
|
View this log when troubleshooting the SMTP interface for VeMail.
|
TAPI
|
View this log when troubleshooting the low-level TAPI driver.
|
IPOSRVR
|
View this log when troubleshooting the TAPI integration.
|
RUNTIMEHOST
|
View this log when troubleshooting the telephony service.
|
MTA
|
View this log when troubleshooting the VeMail server.
|
VOICE
|
View this log when troubleshooting the voice interface.
This log is primarily useful for troubleshooting low-level Dialogic hardware issues.
|
PLUGINADMIN
|
View this log when troubleshooting the administrator telephony interface.
|
PLUGINFEATURES
|
View this log when troubleshooting features in the telephony interface that must be licensed.
|
PLUGINFILEIO
|
View this log when troubleshooting low-level file access issues in certain limited cases; primarily for use by the manufacturer.
|
PLUGINMBOXDIR
|
View this log when troubleshooting issues related to the dial-by-name directory.
|
PLUGINEMS
|
View this log when troubleshooting the notification side of the Martec interface.
|
PLUGINMWI
|
View this log when troubleshooting MWI notification issues.
|
PLUGINMSGDETAILS
|
View this log when troubleshooting issues in the telephony interface when listening to the envelope information for messages (date and time of receipt and sender ID).
|
PLUGINPARSEQA
|
View this log when troubleshooting issues with call handling in a QA mailbox (that is, the processing of the QA script to collect and deliver the caller's responses).
|
PLUGINTRANS
|
View this log when troubleshooting call transfers.
|
PLUGINUSER
|
View this log when troubleshooting issues with the mailbox subscriber menu; specifically, changing the password, editing addresses and editing notifications.
|
PLUGINZIPCODEIO
|
View this log when troubleshooting the Dealer Locator IVR.
|
PLUGINZIPCODE
|
View this log when troubleshooting the Dealer Locator IVR.
|
ZIPCODEDB
|
View this log when troubleshooting the Dealer Locator IVR.
|
|


